SlideShare a Scribd company logo
1 of 9
Download to read offline
4QFY2010 Result Update I Auto Ancillary
                                                                                                                            May 18, 2010


  Motherson Sumi Systems                                                                   BUY
                                                                                           CMP                                     Rs137
  Performance Highlights                                                                   Target Price                            Rs167
  For 4QFY2010, Motherson Sumi Systems (MSSL) clocked a 140.5% yoy                         Investment Period                    12 Months
  growth in consolidated Net Sales to Rs2,028cr (Rs843cr), which exceeded our
  expectations. The numbers for the quarter are not exactly comparable, as                 Stock Info
  4QFY2009 included only the one month results of Samvardhana Motherson
                                                                                           Sector                         Auto Ancillary
  Visiocorp Solution (SMR, acquired during that quarter). The company’s
  Bottom-line registered a significant increase of 84.5% yoy to Rs141.9cr                  Market Cap (Rs cr)                      5,213
  (Rs76.9cr). We have upgraded our consolidated EPS estimates for FY2011E
                                                                                           Beta                                      0.7
  and FY2012E, on account of the better-than-expected 4QFY2010
  performance by the company. We maintain a Buy on the stock.                              52 WK High / Low                     157 / 63

  SMR turns positive at the PAT level in 2HFY2010: SMR registered a positive               Avg. Daily Volume                     102377
  PAT in 2HFY2010. Further, during FY2010, SMR received orders for the                     Face Value (Rs)                             1
  supply of mirrors worth approximately Euro 700mn, to be supplied over the
  life of the new models to be launched in 2011. MSSL has been in the process              BSE Sensex                            16,876
  of restructuring the assets acquired through SMR and registered a qoq                    Nifty                                   5,060
  improvement in Margins. The company achieved its target of around an 8%
  EBITDA margin in 4QFY2010 on the SMR front. The company stands by its                    Reuters Code                      MOSS.BO
  resolve to improve the EBITDA and to generate a decent RoCE.
                                                                                           Bloomberg Code                       MSS @IN

  Outlook and Valuation: We expect MSSL’s consolidated Net Sales to register a             Shareholding Pattern (%)
  substantial growth over FY2010-12E, aided by its strong order-book position.
  On the Margin front, we have modeled an improvement in the OPM in                        Promoters                                67.5
  FY2011E and FY2012E, owing to higher utilisation levels in the domestic and              MF/Banks/Indian FIs                      13.6
  overseas operations, where the company is expected to achieve better
  Operating leverage. We estimate the company to clock a consolidated EPS of               FII/NRIs/OCBs                            10.2
  Rs9 for FY2011E and Rs11.1 for FY2012E. At the CMP, the stock is trading at              Indian Public                             8.7
  15.1x FY2011E and 12.3x FY2012E consolidated Earnings (fully diluted).
  Considering the company’s prospects after the restructuring of SMR and the               Abs. (%)            3m         1yr         3yr
  fact that it is one of the few ancillary companies registering decent numbers,
                                                                                           Sensex              3.4     18.1          18.0
  despite having a high presence in overseas markets, we maintain a Buy on
  the stock, with a Target Price of Rs167, at which the stock would trade at 15x
                                                                                           Motherson           7.7     76.6          84.4
  FY2012E EPS.

  Key Financials
   Y/E March (Rs cr)               FY2009         FY2010E         FY2011E   FY2012E
   Net Sales                         2,640           6,924          8,120     9,192
   % chg                              28.7            162.3          17.3      13.2
   Net Profit                          176              286          350       432
   % chg                              11.0             62.0          22.6      23.2
   OPM (%)                            10.7             10.0          11.3      11.5
   EPS (Rs)                             4.9             6.5           9.0      11.1
   P/E (x)                            27.8             21.1          15.1      12.3
   P/BV (x)                             6.2             4.4           3.9       3.5
   RoE (%)                            26.7             29.4          27.7      29.7
   RoCE (%)                           11.8             21.7          28.5      31.5
                                                                                          Vaishali Jajoo
   EV/Sales (x)                         1.9             0.7           0.6       0.5
                                                                                          Tel: 022 – 4040 3800 Ext: 344
   EV/EBITDA (x)                      18.6              7.6           5.8       5.0
                                                                                          E-mail: vaishali.jajoo@angeltrade.com
   Source: Company, Angel Research


                                                                                                                                            1
Please refer to important disclosures at the end of this report                             Sebi Registration No: INB 010996539
Motherson Sumi Systems I 4QFY2010 Result Update

               Consolidated Results above expectations; Forex gain boosts Bottom-line

               For 4QFY2010, MSSL clocked a 140.5% yoy growth in Net Sales to Rs2,028cr
               (Rs843cr), which exceeded our expectations. The numbers for the quarter are not
               exactly comparable, as 4QFY2009 include only the one month results of
               Samvardhana Motherson Visiocorp Solution (acquired during that quarter). The
               company’s Sales growth came largely on the back of this inorganic operation,
               wherein MSSL’s outside-India Revenue jumped by a significant 187.4% yoy to
               Rs1,306cr (Rs454cr). The company’s Bottom-line also registered a significant
               increase of 84.5% yoy to Rs141.9cr (Rs76.9cr), which again surpassed our
               expectation for the quarter. The Net Profit recorded a substantial jump, due to
               favourable currency movements (helped it register a Forex gain of Rs40cr) during the
               quarter.

               Lower Raw Material and favourable currency movements push Margins up
               yoy; qoq improvement seen on improved, higher Operating efficiencies

               For 4QFY2010, MSSL witnessed a 361bp yoy increase in its EBITDA Margin to
               14.8% (11.2%) owing to favourable currency movements and a 336bp yoy decline
               in Raw Material costs. Other expenditure, however, recorded a yoy increase of
               180bp, while Staff cost to Sales remained flat yoy. The OPM improved by around
               387bp on a qoq basis as well. Thus, the higher Top-line aided Operating Profit
               growth, which surged by 217.8% yoy to Rs301.1cr during 4QFY2010. However,
               higher Interest and Depreciation resulted in a 84.5% yoy jump in the Net Profit to
               Rs141.9cr.

               Exhibit 1: 4QFY2010 Performance (Consolidated)
                Y/E March (Rs cr)                  4QFY10     4QFY09    % chg      FY10    FY09      % chg
                Net Sales (include Other
                                                     2,028       843    140.5     6,924    2,640     162.3
                Op. Inc.)
                Consumption of RM                    1,193       524    127.5     4,166    1,549     168.9
                (% of Sales)                          58.8      62.2                60.2    58.7
                Staff Costs                          301.9     126.2    139.3    1,131.9   344.0     229.1
                (% of Sales)                          14.9      15.0                16.3    13.0
                Exchange Fluctuation                 (51.8)     (4.9)   951.1     (64.9)    33.1    (296.1)
                (% of Sales)                          (2.6)     (0.6)              (0.9)     1.3
                Other Expenses                       283.9     102.9    175.9     996.1    418.7     137.9
                (% of Sales)                          14.0      12.2                14.4    15.9
                Total Expenditure                    1,727       749    130.7     6,229    2,345     165.6
                Operating Profit                     301.1      94.8    217.8     695.0    294.7     135.9
                OPM                                   14.8      11.2                10.0    11.2
                Interest                              21.5      11.2     91.7      62.0     35.4      75.0
                Depreciation                          77.7      35.4    119.6     260.1     97.9     165.7
                Other Income                           0.7       2.4    (71.7)     12.9      5.0     159.5
                PBT (excl. Extr. Items)              202.7      50.6    300.6     385.8    166.3     132.0
                Extr. Income/(Expense)                24.0     (43.5)        -     33.7    (44.8)          -
                PBT (incl. Extr. Items)              178.7      94.1     89.9     352.1    211.1      66.8
                (% of Sales)                           8.8      11.2                 5.1     8.0
                Provision for Taxation                36.8      17.2    114.0     109.4     34.9     213.7
                (% of PBT)                            20.6      18.3                31.1    16.5
                Reported PAT                         141.9      76.9     84.5     242.7    176.3      37.7
                PATM                                   7.0       9.1                 3.5     6.7
                Equity capital (cr)                   37.5      35.6               37.5     35.6
                EPS (Rs)                               3.8       2.2     75.1        6.5     5.0      30.7
               Source: Company, Angel Research


May 18, 2010                                                                                           2
Motherson Sumi Systems I 4QFY2010 Result Update


               Standalone Performance

               On a Standalone basis as well, the company reported a robust 69.9% yoy growth in
               its Top-line to Rs552cr (Rs325cr), and a 242.3% yoy increase in the Bottom-line to
               Rs57.9cr (Rs16.4cr). The Net Profit includes an exchange difference profit of Rs40cr
               (Rs1.3cr loss in 4QFY2009). The OPM (excluding exchange differences) stood higher
               at 19.4% (17.9%). Raw material and Staff costs have witnessed a decline on a yoy
               basis, while the Other expenditure increased by about 147bp yoy.

               Exhibit 2: 4QFY2010 Performance (Standalone)
                Y/E March (Rs cr)                  4QFY10     4QFY09   % chg      FY10       FY09    % chg
                Net Sales (include Other Op.
                                                     551.9     324.8    69.9    1,758.1    1,322.9    32.9
                Inc.)
                Consumption of RM                    315.8     189.9    66.3    1,022.2     779.5     31.1
                (% of Sales)                           57.2     58.5                58.1     58.9
                Staff Costs                           44.9      32.2    39.6      164.5     136.0     21.0
                (% of Sales)                            8.1      9.9                 9.4     10.3
                Exchange Fluctuation                 (40.0)      1.3        -     (55.5)     31.8         -
                (% of Sales)                          (7.3)      0.4               (3.2)      2.4
                Other Expenses                        84.0      44.7    88.0      264.8      205.2    29.1
                (% of Sales)                          15.2      13.8               15.1       15.5
                Total Expenditure                    404.7     268.1    51.0    1,396.0    1,152.3    21.1
                Operating Profit                     147.2      56.8   159.3      362.1      170.5   112.4
                OPM                                   26.7      17.5               20.6       12.9
                Interest                               5.7       7.2   (20.3)      26.5       29.1    (8.9)
                Depreciation                          18.4      14.9     23.6      64.6       54.5    18.5
                Other Income                           1.1       2.0   (42.7)      16.0        9.3    71.7
                PBT (excl. Extr. Items)              124.2      36.7   238.5      287.0       96.2   198.2
                Extr. Income/(Expense)                20.0      11.0        -      20.0       11.0        -
                PBT (incl. Extr. Items)              104.2      25.7   305.6      267.0       85.2   213.3
                (% of Sales)                          18.9       7.9               15.2        6.4
                Provision for Taxation                46.3       9.3   399.0       88.6       15.7   464.2
                (% of PBT)                            44.4      36.1               33.2       18.4
                Reported PAT                          57.9      16.4   252.8      178.5       69.5   156.6
                PATM                                  10.5       5.1               10.2        5.3
                Equity capital (cr)                   37.5      35.6               37.5       35.6
                EPS (Rs)                               1.5       0.5   242.3        4.8        2.0   143.3
               Source: Company, Angel Research


               Segment-wise Performance

               The Auto Segment clocked an 83.2% yoy increase in Sales to Rs539cr (Rs294cr),
               while Non-Auto Sales jumped 84.6% yoy to Rs49.5cr (Rs26.8cr) in 4QFY2010. The
               Auto Segment EBIT increased by almost 186.3% yoy to Rs95.2cr (Rs33.2cr), while
               Non-Auto EBIT spiked a substantial 139.5% yoy to Rs8.3cr (Rs3.5cr) during the
               quarter.


May 18, 2010                                                                                              3
Motherson Sumi Systems I 4QFY2010 Result Update


               Exhibit 3: 4QFY2010 Segmental Performance
                Y/E Mar (Rs cr)            4QFY10         4QFY09     % chg           FY10            FY09      % chg
                Total Net Sales             613.7          327.9      87.2       1,845.7       1,343.6          37.4
                Auto Segment                538.8          294.1      83.2       1,593.5       1,168.5          36.4
                Non-Auto Segment             49.5           26.8      84.6         178.8         147.0          21.6
                Other Segments               25.4            6.9                    73.5          28.0
                Total EBIT                  103.5           36.7     181.9           238.8       120.4          98.4
                Auto Segment                 95.2           33.2     186.3           209.8       108.0          94.3
                Non-Auto Segment              8.3            3.5     139.5            29.1        12.4         134.0
                EBIT Margin (%)              16.9           11.2                      12.9            9.0
                Auto Segment                 17.7           11.3                      13.2            9.2
                Non-Auto Segment             16.8           12.9                      16.3            8.5
               Source: Company, Angel Research


               SMR turns positive at the PAT level in 2HFY2010

               During 4QFY2009, MSSL acquired a global company in the business of rear view
               mirrors from Visiocorp PLC, with Revenues in excess of Euro 660mn and a
               normalised EBITDA of approximately Euro 48mn during 2007. Visiocorp PLC was
               one of the largest players in the rear view mirror business and its customers include
               General Motors, Ford, Hyundai, Volkswagen, Renault/Nissan, Mercedes Benz, BMW,
               Audi, Tata JLR and Maruti Suzuki.

               The acquired entity was incorporated as Samvardhana Motherson Reflectec (SMR) in
               New Jersey on March 6, 2009, and 95% was owned by Samvardhana Motherson
               Global Holdings (SMGHL). The deal was executed for a cash consideration of Euro
               24.8mn and the issue of consideration shares amounting to Euro 1.5mn to the
               lenders of the erstwhile Visiocorp Group. SMGHL is a JV between the company and
               Samvardhana Motherson Finance through their overseas 100% subsidiaries
               (incorporated in Mauritius). SMGHL has acquired various operating companies
               engaged in the design, manufacture, assembly of rear view mirrors, operating in
               Europe, America, Australia and Asia (including India), where MSSL has a successful
               joint venture (JV), in which it holds 49% stake.

               SMR registered a positive PAT in 2HFY2010. Additionally, during FY2010, SMR
               received orders for the supply of mirrors worth approximately Euro 700mn to be
               supplied over the life of the new models to be launched in 2011. MSSL has been in
               the process of restructuring the assets acquired through SMR and registered a qoq
               improvement in Margins. The company achieved its target of around an 8% EBITDA
               margin in 4QFY2010 on the SMR front. The company stands by its resolve to
               improve the EBITDA and to generate a decent RoCE.

               Exhibit 4: SMR Performance
                (Rs cr)                      1QFY10       2QFY10       3QFY10            4QFY10               FY10
                Net Sales                        882.4      973.9      1,120.6           1,181.9            4,158.7
                India                             32.2       36.4            42.3             48.4           159.3
                Outside India                    850.2      937.5      1,078.2           1,133.5            3,999.5
                PBIDT                             15.1       45.2            72.8            103.1           236.2
                OPM(%)                              1.7       4.6             6.5              8.7              5.7
                Exceptional Inc. / (exp)         (17.1)     (22.9)           (9.0)            92.1            43.0
                PAT                              (44.4)     (24.3)            9.2             68.1              8.7
                Minority Share                   (22.1)     (13.8)            4.4             34.1              2.8
                PAT                              (22.3)     (10.5)            4.7             33.8              5.9
                Source: Company, Angel Research


May 18, 2010                                                                                                          4
Motherson Sumi Systems I 4QFY2010 Result Update


               Outlook and Valuation

               MSSL is a leader in Wire Harnessing, controlling over 65% of the domestic
               passenger vehicle (PV) market and around a 48% market share in the domestic Rear
               View Mirror market. After the recent acquisition, the company now controls around
               25% of the global Rear View Mirror market. The company is now focusing on the
               supply of higher level assemblies and modules, where Margins are comparatively
               higher. MSSL is also increasing its content per car, in a bid to diversify its product
               portfolio. The company is laying emphasis on its global product plan (GPP), where it
               is looking at setting up JVs with leading Tier-I suppliers to upgrade its technology
               base and to bolster its clientele as well.

               We expect MSSL’s consolidated Net Sales to register a substantial growth over
               FY2010-12E, aided by its strong order-book position. On the Margin front, we have
               modeled an improvement in the OPM in FY2011E and FY2012E, owing to higher
               utilisation levels in the domestic and overseas operations, where the company is
               expected to achieve better Operating leverage.

               We estimate the company to clock a consolidated EPS of Rs9 for FY2011E and
               Rs11.1 for FY2012E. At the CMP, the stock is trading at 15.1x FY2011E and 12.3x
               FY2012E consolidated Earnings (fully diluted). Considering the company’s prospects
               after the restructuring of SMR and the fact that it is one of the few ancillary
               companies registering decent numbers, despite having a high presence in overseas
               markets, we maintain a Buy on the stock, with a Target Price of Rs167, at which the
               stock would trade at 15x FY2012E EPS.

               Exhibit 5: One year forward P/E Band
                                    200
                                    180                                                                                                                                                                                                           19x
                                    160
                                    140                                                                                                                                                                                                           15x
                 Share Price (Rs)


                                    120
                                                                                                                                                                                                                                                  11x
                                    100
                                     80
                                                                                                                                                                                                                                                    7x
                                     60
                                     40
                                     20
                                      0
                                          Apr-02


                                                                   Apr-03


                                                                                           Apr-04


                                                                                                                   Apr-05


                                                                                                                                           Apr-06


                                                                                                                                                                   Apr-07


                                                                                                                                                                                           Apr-08


                                                                                                                                                                                                                   Apr-09


                                                                                                                                                                                                                                         Apr-10
                                                       Oct-02


                                                                               Oct-03


                                                                                                       Oct-04


                                                                                                                               Oct-05


                                                                                                                                                       Oct-06


                                                                                                                                                                               Oct-07


                                                                                                                                                                                                       Oct-08


                                                                                                                                                                                                                              Oct-09


               Source: Company, Angel Research

               Exhibit 6: One year forward EV/EBIDTA Band
                                    9,000
                                                                                                                                                                                                                                                    9x
                                    8,000
                                    7,000
                                                                                                                                                                                                                                                    7x
                                    6,000
                                    5,000
                EV (Rs cr)


                                                                                                                                                                                                                                                    5x
                                    4,000
                                    3,000                                                                                                                                                                                                           3x
                                    2,000
                                    1,000
                                          0
                                              Apr-02


                                                                      Apr-03


                                                                                              Apr-04


                                                                                                                      Apr-05


                                                                                                                                              Apr-06


                                                                                                                                                                      Apr-07


                                                                                                                                                                                              Apr-08


                                                                                                                                                                                                                     Apr-09


                                                                                                                                                                                                                                           Apr-10
                                                          Oct-02


                                                                                  Oct-03


                                                                                                          Oct-04


                                                                                                                                  Oct-05


                                                                                                                                                          Oct-06


                                                                                                                                                                                  Oct-07


                                                                                                                                                                                                          Oct-08


                                                                                                                                                                                                                                Oct-09


               Source: Company, Angel Research

May 18, 2010                                                                                                                                                                                                                                         5
Motherson Sumi Systems I 4QFY2010 Result Update


               Profit & Loss Statement                                                          (Rs cr)
                Y/E March                      FY2007   FY2008   FY2009    FY2010   FY2011E   FY2012E
                Gross sales                     1,706    2,272    2,783     7,526     8,826     9,991
                Less: Excise duty                179      244       188      602       706        799
                Net Sales                       1,528    2,052    2,640     6,924     8,120     9,192
                Total operating income          1,528    2,052    2,640     6,924     8,120     9,192
                % chg                            50.4     34.3     28.7     162.3      17.3      13.2
                Total Expenditure               1,307    1,755    2,356     6,229     7,207     8,135
                Net Raw Materials                864     1,124    1,549     4,166     5,055     5,791
                Other Mfg costs                  112      142       141         -      406        460
                Personnel                        168      247       344     1,132     1,177     1,241
                Other                            163      242       322      931       568        643
                EBITDA                           221      297      283       695       914      1,057
                % chg                            38.5     34.6     (4.6)    145.2      31.4      15.7
                (% of Net Sales)                 14.4     14.5     10.7      10.0      11.3      11.5
                Depreciation& Amortisation        65       85       109      260       288        314
                EBIT                             156      212      174       435       626        743
                % chg                            38.0     36.1    (17.9)    149.4      43.9      18.7
                (% of Net Sales)                 10.2     10.4      6.6       6.3       7.7        8.1
                Interest & other Charges          29       29        38       62        53         46
                Other Income                      35       43       120       13        14         14
                (% of PBT)                       21.9     20.5     47.0       3.8       2.3        2.0
                Recurring PBT                    162      226      256       386       587        711
                % chg                            28.9     39.4     13.1      50.8      52.1      21.2
                Extraordinary Expense/(Inc.)       0       19         1       43          -          -
                PBT (reported)                   162      207      255       343       587        711
                Tax                               34       51        35      109       191        231
                (% of PBT)                       20.7     24.7     13.6      31.9      32.5      32.5
                PAT (reported)                   128      156      220       233       396        480
                Less: Minority interest (MI)      (1)      (3)       45       (9)       46         49
                PAT after MI (reported)          129      159       175      243       350        432
                ADJ. PAT                         130      178      176       286       350        432
                % chg                            20.9     37.3     (0.9)     62.0      22.6      23.2
                (% of Net Sales)                  8.5      8.7      6.7       4.1       4.3        4.7
                Basic EPS (Rs)                    3.7      4.5      4.9       6.5       9.0      11.1
                Fully Diluted EPS (Rs)            3.3      4.1      4.5       6.3       9.0      11.1
                % chg                            20.1     22.9     10.3      38.5      44.4      23.2


May 18, 2010                                                                                         6
Motherson Sumi Systems I 4QFY2010 Result Update


               Balance Sheet                                                                            (Rs cr)
                Y/E March                            FY2007    FY2008    FY2009   FY2010E   FY2011E   FY2012E
                SOURCES OF FUNDS
                Equity Share Capital                    23         36       36        37        39        39
                Preference Capital                        -          -        -         -         -         -
                Reserves& Surplus                      356       500       748      1,122     1,330     1,501
                Shareholders Funds                     380       536       783      1,159     1,369     1,539
                Minority Interest                       14         23      200       191       237       285
                Total Loans                            460       489       895       757       657       607
                Deferred Tax Liability                    7         4       15        15        12          8
                Total Liabilities                      861      1,052     1,893     2,122     2,275     2,440
                APPLICATION OF FUNDS
                Gross Block                            762       949      3,018     3,297     3,641     3,979
                Less: Acc. Depreciation                277       346      1,628     1,888     2,175     2,490
                Net Block                              485       603      1,390     1,409     1,466     1,489
                Capital Work-in-Progress                18         28      151       165       182       199
                Goodwill                                  -          -        -         -         -         -
                Investments                               5         5        8        11        11        12
                Current Assets                         677       904      1,914     3,623     4,025     4,208
                Cash                                    99         95      277        49        68        47
                Loans & Advances                       136       190       413      1,039     1,218     1,379
                Other                                  441       618      1,224     2,535     2,739     2,783
                Current liabilities                    382       531      1,597     3,086     3,410     3,469
                Net Current Assets                     295       373       317       537       615       739
                Mis. Exp. not written off               58         42       27          -         -         -
                Total Assets                           861      1,052     1,893     2,122     2,275     2,440

               Cash Flow (Consolidated)                                                                 (Rs cr)
                Y/E March                            FY2007    FY2008    FY2009   FY2010E   FY2011E   FY2012E
                Profit before tax                      162       207       255       343       587       711
                Depreciation                            65         85      109       260       288       314
                Change in Working Capital               12        (52)    (752)     (549)     (198)     (223)
                Less: Other income                     142         48     (450)      247        56       108
                Direct taxes paid                       34         51        35      109       191       231
                Cash Flow from Operations                64      141         27     (303)      430       463
                Inc./ (Dec.) in Fixed Assets           184       197      2,191      293       361       355
                Inc./ (Dec.) in Investments               0         0         3         2         1         1
                Inc./ (Dec.) in loans and advances       28        55      222       626       179         80
                Other income                             28        10     1,825         -         -         -
                Cash Flow from Investing              (156)     (232)     1,234     (921)     (542)     (435)
                Issue of Equity                            -       12         -         2         1         -
                Inc./(Dec.) in loans                     34        29      406      (138)     (100)      (50)
                Dividend Paid (Incl. Tax)                31        42        56       57        77       113
                Others                                   (7)      (12)       17         -         -         -
                Cash Flow from Financing                 13        11      333      (193)     (175)     (163)
                Inc./(Dec.) in Cash                    (79)        (4)     178      (227)       19       (22)
                Opening Cash balances                  172         99        95      277        49         68
                Closing Cash balances                    99        95      277        49        68         47


May 18, 2010                                                                                                 7
Motherson Sumi Systems I 4QFY2010 Result Update


               Key Ratios
                Y/E March                         FY2007   FY2008   FY2009   FY2010E   FY2011E   FY2012E
                Valuation Ratio (x)
                P/E (on FDEPS)                      37.3     30.6     27.8      21.1      15.1      12.3
                P/CEPS                              24.9     18.7     14.7      10.2       8.3       7.1
                P/BV                                12.8      9.1      6.2       4.4       3.9       3.5
                Dividend yield (%)                   1.1      1.0      1.0       1.3       1.8       2.2
                EV/Sales                             3.1      2.3      1.9       0.7       0.6       0.5
                EV/EBITDA                           23.8     17.7     18.6       7.6       5.8       5.0
                EV / Total Assets                    5.7      4.7      2.7       2.5       2.3       2.1
                EPS (Basic)                          3.7      4.5      4.9       6.5       9.0      11.1
                EPS (fully diluted)                  3.3      4.1      4.5       6.3       9.0      11.1
                Cash EPS                             5.5      7.3      9.3      13.4      16.5      19.2
                DPS                                  1.0      1.3      1.3       1.8       2.5       3.0
                Book Value                          10.7     15.0     22.0      30.9      35.3      39.7
                Dupont Analysis
                EBIT margin                         10.2     10.4      6.6       6.3       7.7       8.1
                Tax retention ratio                  0.8      0.8      0.9       0.7       0.7       0.7
                Asset turnover (x)                   2.3      2.4      2.1       3.8       3.8       4.0
                ROIC (Post-tax)                     18.8     18.7     11.7      16.1      19.8      21.8
                Cost of Debt (Post Tax)              5.2      4.6      4.8       5.1       5.0       4.9
                Leverage (x)                         0.9      0.8      0.8       0.7       0.5       0.4
                Operating ROE                       31.0     30.1     17.0      23.5      27.2      28.4
                Returns (%)
                ROCE (Pre-tax)                      19.6     22.2     11.8      21.7      28.5      31.5
                Angel ROIC (Pre-tax)                20.5     22.3     10.8      21.0      28.4      31.1
                ROE                                 38.5     38.9     26.7      29.4      27.7      29.7
                Turnover ratios (x)
                Asset Turnover (Gross Block)         2.3      2.4      1.3       2.2       2.3       2.4
                Inventory / Sales (days)             41       44       62        42        47        47
                Receivables (days)                   46       51       65        81        73        61
                Payables (days)                      51       55      110       103       126       119
                WCapital cycle (ex-cash) (days)      35       42       22        14        23        25
                Solvency ratios (x)
                Net debt to equity                   0.9      0.7      0.8       0.6       0.4       0.4
                Net debt to EBITDA                   1.6      1.3      2.2       1.0       0.6       0.5
                Interest Coverage (EBIT / Int.)      5.3      7.4      4.5       7.0      11.9      16.3


May 18, 2010                                                                                           8
Motherson Sumi Systems I 4QFY2010 Result Update


Research Team Tel: 022-4040 3800                                           E-mail: research@angeltrade.com                                       Website: www.angeltrade.com


DISCLAIMER

This document is solely for the personal information of the recipient, and must not be singularly used as the basis of any investment decision. Nothing in this
document should be construed as investment or financial advice. Each recipient of this document should make such investigations as they deem necessary to
arrive at an independent evaluation of an investment in the securities of the companies referred to in this document (including the merits and risks involved),
and should consult their own advisors to determine the merits and risks of such an investment.

Angel Securities Limited, its affiliates, directors, its proprietary trading and investment businesses may, from time to time, make investment decisions that are
inconsistent with or contradictory to the recommendations expressed herein. The views contained in this document are those of the analyst, and the company
may or may not subscribe to all the views expressed within.

Reports based on technical and derivative analysis center on studying charts of a stock's price movement, outstanding positions and trading volume, as
opposed to focusing on a company's fundamentals and, as such, may not match with a report on a company's fundamentals.

The information in this document has been printed on the basis of publicly available information, internal data and other reliable sources believed to be true,
and is for general guidance only. Angel Securities Limited has not independently verified all the information contained within this document. Accordingly, we
cannot testify, nor make any representation or warranty, express or implied, to the accuracy, contents or data contained within this document. While Angel
Securities Limited endeavours to update on a reasonable basis the information discussed in this material, there may be regulatory, compliance, or other
reasons that prevent us from doing so.

This document is being supplied to you solely for your information, and its contents, information or data may not be reproduced, redistributed or passed on,
directly or indirectly.

Angel Securities Limited and its affiliates may seek to provide or have engaged in providing corporate finance, investment banking or other advisory services
in a merger or specific transaction to the companies referred to in this report, as on the date of this report or in the past.

Neither Angel Securities Limited, nor its directors, employees or affiliates shall be liable for any loss or damage that may arise from or in connection with the
use of this information.
Note: Please refer to the important `Stock Holding Disclosure' report on the Angel website (Research Section).


    Disclosure of Interest Statement                                                                   Motherson Sumi
    1. Analyst ownership of the stock                                                                           No
    2. Angel and its Group companies ownership of the stock                                                     No
    3. Angel and its Group companies’ Directors ownership of the stock                                          No
    4. Broking relationship with company covered                                                                No
    Note: We have not considered any Exposure below Rs 1 lakh for Angel and its Group companies.
.


                                  Address: Acme Plaza, ‘A’ Wing, 3rd Floor, M.V. Road, Opp. Sangam Cinema, Andheri (E), Mumbai - 400 059.
                                                                      Tel: (022) 3952 4568 / 4040 3800


      Angel Broking Ltd: BSE Sebi Regn No : INB 010996539 / CDSL Regn No: IN - DP - CDSL - 234 - 2004 / PMS Regn Code: PM/INP000001546 Angel Securities Ltd:BSE: INB010994639/INF010994639 NSE:
      INB230994635/INF230994635 Membership numbers: BSE 028/NSE:09946
      Angel Capital & Debt Market Ltd: INB 231279838 / NSE FNO: INF 231279838 / NSE Member code -12798 Angel Commodities Broking (P) Ltd: MCX Member ID: 12685 / FMC Regn No: MCX / TCM /
      CORP / 0037 NCDEX : Member ID 00220 / FMC Regn No: NCDEX / TCM / CORP / 0302


May 18, 2010                                                                                                                                                                                  9

More Related Content

What's hot

Bajaj auto ru4 qfy2010-140510
Bajaj auto ru4 qfy2010-140510Bajaj auto ru4 qfy2010-140510
Bajaj auto ru4 qfy2010-140510Angel Broking
 
Tvs motor ru4 qfy2010-21042010
Tvs motor ru4 qfy2010-21042010Tvs motor ru4 qfy2010-21042010
Tvs motor ru4 qfy2010-21042010Angel Broking
 
Dlf ru4 qfy2010-17052010
Dlf  ru4 qfy2010-17052010Dlf  ru4 qfy2010-17052010
Dlf ru4 qfy2010-17052010Angel Broking
 
Infosys 4QFY2010 Result Update
Infosys 4QFY2010 Result UpdateInfosys 4QFY2010 Result Update
Infosys 4QFY2010 Result UpdateAngel Broking
 
McNally Result Update 4qfy2010-180510
McNally Result Update 4qfy2010-180510McNally Result Update 4qfy2010-180510
McNally Result Update 4qfy2010-180510Angel Broking
 
Motherson Sumi Systems
Motherson Sumi Systems Motherson Sumi Systems
Motherson Sumi Systems Angel Broking
 
Jyoti structures ru4 qfy2010-240510
Jyoti structures ru4 qfy2010-240510Jyoti structures ru4 qfy2010-240510
Jyoti structures ru4 qfy2010-240510Angel Broking
 
Blue star ru4 qfy2010-190510
Blue star ru4 qfy2010-190510Blue star ru4 qfy2010-190510
Blue star ru4 qfy2010-190510Angel Broking
 
Ashok leyland ru4 qfy2010-300410
Ashok leyland ru4 qfy2010-300410Ashok leyland ru4 qfy2010-300410
Ashok leyland ru4 qfy2010-300410Angel Broking
 
Graphite india ru4 qfy2010-140510
Graphite india ru4 qfy2010-140510Graphite india ru4 qfy2010-140510
Graphite india ru4 qfy2010-140510Angel Broking
 
Jk tyre ru4 qfy2010-260510
Jk tyre ru4 qfy2010-260510Jk tyre ru4 qfy2010-260510
Jk tyre ru4 qfy2010-260510Angel Broking
 
Bajaj electricals ru4-qfy2010-280510
Bajaj electricals ru4-qfy2010-280510Bajaj electricals ru4-qfy2010-280510
Bajaj electricals ru4-qfy2010-280510Angel Broking
 
Shoppers stop result update 4 qfy2010 040510
Shoppers stop result update 4 qfy2010 040510Shoppers stop result update 4 qfy2010 040510
Shoppers stop result update 4 qfy2010 040510Angel Broking
 
Concor Result Update
Concor Result UpdateConcor Result Update
Concor Result UpdateAngel Broking
 

What's hot (19)

Bajaj auto ru4 qfy2010-140510
Bajaj auto ru4 qfy2010-140510Bajaj auto ru4 qfy2010-140510
Bajaj auto ru4 qfy2010-140510
 
Ceat
Ceat Ceat
Ceat
 
Tvs motor ru4 qfy2010-21042010
Tvs motor ru4 qfy2010-21042010Tvs motor ru4 qfy2010-21042010
Tvs motor ru4 qfy2010-21042010
 
Dlf ru4 qfy2010-17052010
Dlf  ru4 qfy2010-17052010Dlf  ru4 qfy2010-17052010
Dlf ru4 qfy2010-17052010
 
Infosys 4QFY2010 Result Update
Infosys 4QFY2010 Result UpdateInfosys 4QFY2010 Result Update
Infosys 4QFY2010 Result Update
 
McNally Result Update 4qfy2010-180510
McNally Result Update 4qfy2010-180510McNally Result Update 4qfy2010-180510
McNally Result Update 4qfy2010-180510
 
Motherson Sumi Systems
Motherson Sumi Systems Motherson Sumi Systems
Motherson Sumi Systems
 
RIL Result Update
RIL Result UpdateRIL Result Update
RIL Result Update
 
Jyoti structures ru4 qfy2010-240510
Jyoti structures ru4 qfy2010-240510Jyoti structures ru4 qfy2010-240510
Jyoti structures ru4 qfy2010-240510
 
Blue star ru4 qfy2010-190510
Blue star ru4 qfy2010-190510Blue star ru4 qfy2010-190510
Blue star ru4 qfy2010-190510
 
Ashok leyland ru4 qfy2010-300410
Ashok leyland ru4 qfy2010-300410Ashok leyland ru4 qfy2010-300410
Ashok leyland ru4 qfy2010-300410
 
Graphite india ru4 qfy2010-140510
Graphite india ru4 qfy2010-140510Graphite india ru4 qfy2010-140510
Graphite india ru4 qfy2010-140510
 
TVS Motor
TVS MotorTVS Motor
TVS Motor
 
Jk tyre ru4 qfy2010-260510
Jk tyre ru4 qfy2010-260510Jk tyre ru4 qfy2010-260510
Jk tyre ru4 qfy2010-260510
 
Sadbhav
SadbhavSadbhav
Sadbhav
 
Bajaj electricals ru4-qfy2010-280510
Bajaj electricals ru4-qfy2010-280510Bajaj electricals ru4-qfy2010-280510
Bajaj electricals ru4-qfy2010-280510
 
Indoco Remedies
Indoco RemediesIndoco Remedies
Indoco Remedies
 
Shoppers stop result update 4 qfy2010 040510
Shoppers stop result update 4 qfy2010 040510Shoppers stop result update 4 qfy2010 040510
Shoppers stop result update 4 qfy2010 040510
 
Concor Result Update
Concor Result UpdateConcor Result Update
Concor Result Update
 

Similar to Motherson sumi ru4 qfy2010-180510

JISL Result Update 4 qfy2010-120510
JISL Result Update 4 qfy2010-120510JISL Result Update 4 qfy2010-120510
JISL Result Update 4 qfy2010-120510Angel Broking
 
Apollo ru4 qfy2010-280510
Apollo ru4 qfy2010-280510Apollo ru4 qfy2010-280510
Apollo ru4 qfy2010-280510Angel Broking
 
Sadbhav engg ru4 qfy2010-240510
Sadbhav engg ru4 qfy2010-240510Sadbhav engg ru4 qfy2010-240510
Sadbhav engg ru4 qfy2010-240510Angel Broking
 
Crompton greaves ru4 qfy2010-180510
Crompton greaves ru4 qfy2010-180510Crompton greaves ru4 qfy2010-180510
Crompton greaves ru4 qfy2010-180510Angel Broking
 
Crompton greaves ru4 qfy2010-180510
Crompton greaves ru4 qfy2010-180510Crompton greaves ru4 qfy2010-180510
Crompton greaves ru4 qfy2010-180510Angel Broking
 
Maruti suzuki Result Update
Maruti suzuki Result UpdateMaruti suzuki Result Update
Maruti suzuki Result UpdateAngel Broking
 
TCS 4QFY2010 Results Update
TCS 4QFY2010 Results UpdateTCS 4QFY2010 Results Update
TCS 4QFY2010 Results UpdateAngel Broking
 
Indoco Result Update
Indoco Result UpdateIndoco Result Update
Indoco Result UpdateAngel Broking
 
India cements result update 4 qfy2010-060510
India cements  result update 4 qfy2010-060510India cements  result update 4 qfy2010-060510
India cements result update 4 qfy2010-060510Angel Broking
 
Rallis Result Update
Rallis Result UpdateRallis Result Update
Rallis Result UpdateAngel Broking
 
Infosys - Result Update
Infosys  - Result UpdateInfosys  - Result Update
Infosys - Result UpdateAngel Broking
 
Indian Bank Result Update
Indian Bank Result UpdateIndian Bank Result Update
Indian Bank Result UpdateAngel Broking
 
Tata motors ru4 qfy2010-280510
Tata motors  ru4 qfy2010-280510Tata motors  ru4 qfy2010-280510
Tata motors ru4 qfy2010-280510Angel Broking
 
Bgr energy ru4 qfy2010-010610
Bgr energy ru4 qfy2010-010610Bgr energy ru4 qfy2010-010610
Bgr energy ru4 qfy2010-010610Angel Broking
 

Similar to Motherson sumi ru4 qfy2010-180510 (19)

Automotive Axles
Automotive Axles Automotive Axles
Automotive Axles
 
JISL Result Update 4 qfy2010-120510
JISL Result Update 4 qfy2010-120510JISL Result Update 4 qfy2010-120510
JISL Result Update 4 qfy2010-120510
 
Tech Mahindra
Tech Mahindra Tech Mahindra
Tech Mahindra
 
Apollo ru4 qfy2010-280510
Apollo ru4 qfy2010-280510Apollo ru4 qfy2010-280510
Apollo ru4 qfy2010-280510
 
Sadbhav engg ru4 qfy2010-240510
Sadbhav engg ru4 qfy2010-240510Sadbhav engg ru4 qfy2010-240510
Sadbhav engg ru4 qfy2010-240510
 
Crompton greaves ru4 qfy2010-180510
Crompton greaves ru4 qfy2010-180510Crompton greaves ru4 qfy2010-180510
Crompton greaves ru4 qfy2010-180510
 
Crompton greaves ru4 qfy2010-180510
Crompton greaves ru4 qfy2010-180510Crompton greaves ru4 qfy2010-180510
Crompton greaves ru4 qfy2010-180510
 
Maruti suzuki Result Update
Maruti suzuki Result UpdateMaruti suzuki Result Update
Maruti suzuki Result Update
 
Simplex Infra
Simplex InfraSimplex Infra
Simplex Infra
 
TCS 4QFY2010 Results Update
TCS 4QFY2010 Results UpdateTCS 4QFY2010 Results Update
TCS 4QFY2010 Results Update
 
Indoco Result Update
Indoco Result UpdateIndoco Result Update
Indoco Result Update
 
India cements result update 4 qfy2010-060510
India cements  result update 4 qfy2010-060510India cements  result update 4 qfy2010-060510
India cements result update 4 qfy2010-060510
 
Wipro
Wipro  Wipro
Wipro
 
Rallis Result Update
Rallis Result UpdateRallis Result Update
Rallis Result Update
 
Fag y2010-220410
Fag y2010-220410Fag y2010-220410
Fag y2010-220410
 
Infosys - Result Update
Infosys  - Result UpdateInfosys  - Result Update
Infosys - Result Update
 
Indian Bank Result Update
Indian Bank Result UpdateIndian Bank Result Update
Indian Bank Result Update
 
Tata motors ru4 qfy2010-280510
Tata motors  ru4 qfy2010-280510Tata motors  ru4 qfy2010-280510
Tata motors ru4 qfy2010-280510
 
Bgr energy ru4 qfy2010-010610
Bgr energy ru4 qfy2010-010610Bgr energy ru4 qfy2010-010610
Bgr energy ru4 qfy2010-010610
 

More from Angel Broking

Market outlook 110612
Market outlook 110612Market outlook 110612
Market outlook 110612Angel Broking
 
Axis%20 bank ru1qfy2012-220711
Axis%20 bank ru1qfy2012-220711Axis%20 bank ru1qfy2012-220711
Axis%20 bank ru1qfy2012-220711Angel Broking
 
Electrosteel castings
Electrosteel castingsElectrosteel castings
Electrosteel castingsAngel Broking
 
Derivative report 19th July 2011
Derivative report 19th July 2011Derivative report 19th July 2011
Derivative report 19th July 2011Angel Broking
 
Market outlook 19th July 2011
Market outlook 19th July 2011Market outlook 19th July 2011
Market outlook 19th July 2011Angel Broking
 
Weekly Report 18th July 2011
Weekly Report 18th July 2011Weekly Report 18th July 2011
Weekly Report 18th July 2011Angel Broking
 
Derivative Report 18th July 2011
Derivative Report 18th July 2011Derivative Report 18th July 2011
Derivative Report 18th July 2011Angel Broking
 
Technical Report 18th July 2011
Technical Report 18th July 2011Technical Report 18th July 2011
Technical Report 18th July 2011Angel Broking
 
Market Outlook 18th July 2011
Market Outlook 18th July 2011Market Outlook 18th July 2011
Market Outlook 18th July 2011Angel Broking
 
Bajaj auto Result Updated
Bajaj auto Result UpdatedBajaj auto Result Updated
Bajaj auto Result UpdatedAngel Broking
 
Tata consultancy services
Tata consultancy services Tata consultancy services
Tata consultancy services Angel Broking
 
Derivatives Report 15th July 2011
Derivatives Report 15th July 2011Derivatives Report 15th July 2011
Derivatives Report 15th July 2011Angel Broking
 
Technical Report 15th July 2011
Technical Report 15th July 2011Technical Report 15th July 2011
Technical Report 15th July 2011Angel Broking
 
Infosys Result Updated
Infosys Result UpdatedInfosys Result Updated
Infosys Result UpdatedAngel Broking
 
Derivative Report 13th July 2011
Derivative Report 13th July 2011Derivative Report 13th July 2011
Derivative Report 13th July 2011Angel Broking
 

More from Angel Broking (20)

Market outlook 110612
Market outlook 110612Market outlook 110612
Market outlook 110612
 
Axis%20 bank ru1qfy2012-220711
Axis%20 bank ru1qfy2012-220711Axis%20 bank ru1qfy2012-220711
Axis%20 bank ru1qfy2012-220711
 
Electrosteel castings
Electrosteel castingsElectrosteel castings
Electrosteel castings
 
Persistent systems
Persistent systemsPersistent systems
Persistent systems
 
Ht media
Ht mediaHt media
Ht media
 
Derivative report 19th July 2011
Derivative report 19th July 2011Derivative report 19th July 2011
Derivative report 19th July 2011
 
Market outlook 19th July 2011
Market outlook 19th July 2011Market outlook 19th July 2011
Market outlook 19th July 2011
 
Telecom sector
Telecom sectorTelecom sector
Telecom sector
 
Weekly Report 18th July 2011
Weekly Report 18th July 2011Weekly Report 18th July 2011
Weekly Report 18th July 2011
 
Derivative Report 18th July 2011
Derivative Report 18th July 2011Derivative Report 18th July 2011
Derivative Report 18th July 2011
 
Technical Report 18th July 2011
Technical Report 18th July 2011Technical Report 18th July 2011
Technical Report 18th July 2011
 
Market Outlook 18th July 2011
Market Outlook 18th July 2011Market Outlook 18th July 2011
Market Outlook 18th July 2011
 
South Indian Bank
 South Indian Bank South Indian Bank
South Indian Bank
 
Bajaj auto Result Updated
Bajaj auto Result UpdatedBajaj auto Result Updated
Bajaj auto Result Updated
 
Tata consultancy services
Tata consultancy services Tata consultancy services
Tata consultancy services
 
Fc4 e63c4d01
Fc4 e63c4d01Fc4 e63c4d01
Fc4 e63c4d01
 
Derivatives Report 15th July 2011
Derivatives Report 15th July 2011Derivatives Report 15th July 2011
Derivatives Report 15th July 2011
 
Technical Report 15th July 2011
Technical Report 15th July 2011Technical Report 15th July 2011
Technical Report 15th July 2011
 
Infosys Result Updated
Infosys Result UpdatedInfosys Result Updated
Infosys Result Updated
 
Derivative Report 13th July 2011
Derivative Report 13th July 2011Derivative Report 13th July 2011
Derivative Report 13th July 2011
 

Motherson sumi ru4 qfy2010-180510

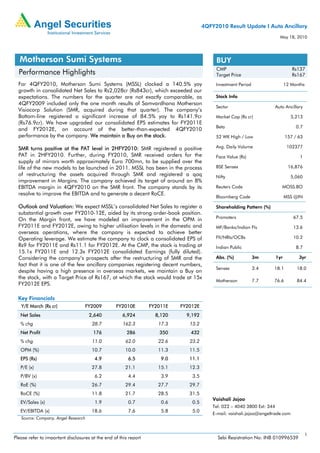
  • 1. 4QFY2010 Result Update I Auto Ancillary May 18, 2010 Motherson Sumi Systems BUY CMP Rs137 Performance Highlights Target Price Rs167 For 4QFY2010, Motherson Sumi Systems (MSSL) clocked a 140.5% yoy Investment Period 12 Months growth in consolidated Net Sales to Rs2,028cr (Rs843cr), which exceeded our expectations. The numbers for the quarter are not exactly comparable, as Stock Info 4QFY2009 included only the one month results of Samvardhana Motherson Sector Auto Ancillary Visiocorp Solution (SMR, acquired during that quarter). The company’s Bottom-line registered a significant increase of 84.5% yoy to Rs141.9cr Market Cap (Rs cr) 5,213 (Rs76.9cr). We have upgraded our consolidated EPS estimates for FY2011E Beta 0.7 and FY2012E, on account of the better-than-expected 4QFY2010 performance by the company. We maintain a Buy on the stock. 52 WK High / Low 157 / 63 SMR turns positive at the PAT level in 2HFY2010: SMR registered a positive Avg. Daily Volume 102377 PAT in 2HFY2010. Further, during FY2010, SMR received orders for the Face Value (Rs) 1 supply of mirrors worth approximately Euro 700mn, to be supplied over the life of the new models to be launched in 2011. MSSL has been in the process BSE Sensex 16,876 of restructuring the assets acquired through SMR and registered a qoq Nifty 5,060 improvement in Margins. The company achieved its target of around an 8% EBITDA margin in 4QFY2010 on the SMR front. The company stands by its Reuters Code MOSS.BO resolve to improve the EBITDA and to generate a decent RoCE. Bloomberg Code MSS @IN Outlook and Valuation: We expect MSSL’s consolidated Net Sales to register a Shareholding Pattern (%) substantial growth over FY2010-12E, aided by its strong order-book position. On the Margin front, we have modeled an improvement in the OPM in Promoters 67.5 FY2011E and FY2012E, owing to higher utilisation levels in the domestic and MF/Banks/Indian FIs 13.6 overseas operations, where the company is expected to achieve better Operating leverage. We estimate the company to clock a consolidated EPS of FII/NRIs/OCBs 10.2 Rs9 for FY2011E and Rs11.1 for FY2012E. At the CMP, the stock is trading at Indian Public 8.7 15.1x FY2011E and 12.3x FY2012E consolidated Earnings (fully diluted). Considering the company’s prospects after the restructuring of SMR and the Abs. (%) 3m 1yr 3yr fact that it is one of the few ancillary companies registering decent numbers, Sensex 3.4 18.1 18.0 despite having a high presence in overseas markets, we maintain a Buy on the stock, with a Target Price of Rs167, at which the stock would trade at 15x Motherson 7.7 76.6 84.4 FY2012E EPS. Key Financials Y/E March (Rs cr) FY2009 FY2010E FY2011E FY2012E Net Sales 2,640 6,924 8,120 9,192 % chg 28.7 162.3 17.3 13.2 Net Profit 176 286 350 432 % chg 11.0 62.0 22.6 23.2 OPM (%) 10.7 10.0 11.3 11.5 EPS (Rs) 4.9 6.5 9.0 11.1 P/E (x) 27.8 21.1 15.1 12.3 P/BV (x) 6.2 4.4 3.9 3.5 RoE (%) 26.7 29.4 27.7 29.7 RoCE (%) 11.8 21.7 28.5 31.5 Vaishali Jajoo EV/Sales (x) 1.9 0.7 0.6 0.5 Tel: 022 – 4040 3800 Ext: 344 EV/EBITDA (x) 18.6 7.6 5.8 5.0 E-mail: vaishali.jajoo@angeltrade.com Source: Company, Angel Research 1 Please refer to important disclosures at the end of this report Sebi Registration No: INB 010996539
  • 2. Motherson Sumi Systems I 4QFY2010 Result Update Consolidated Results above expectations; Forex gain boosts Bottom-line For 4QFY2010, MSSL clocked a 140.5% yoy growth in Net Sales to Rs2,028cr (Rs843cr), which exceeded our expectations. The numbers for the quarter are not exactly comparable, as 4QFY2009 include only the one month results of Samvardhana Motherson Visiocorp Solution (acquired during that quarter). The company’s Sales growth came largely on the back of this inorganic operation, wherein MSSL’s outside-India Revenue jumped by a significant 187.4% yoy to Rs1,306cr (Rs454cr). The company’s Bottom-line also registered a significant increase of 84.5% yoy to Rs141.9cr (Rs76.9cr), which again surpassed our expectation for the quarter. The Net Profit recorded a substantial jump, due to favourable currency movements (helped it register a Forex gain of Rs40cr) during the quarter. Lower Raw Material and favourable currency movements push Margins up yoy; qoq improvement seen on improved, higher Operating efficiencies For 4QFY2010, MSSL witnessed a 361bp yoy increase in its EBITDA Margin to 14.8% (11.2%) owing to favourable currency movements and a 336bp yoy decline in Raw Material costs. Other expenditure, however, recorded a yoy increase of 180bp, while Staff cost to Sales remained flat yoy. The OPM improved by around 387bp on a qoq basis as well. Thus, the higher Top-line aided Operating Profit growth, which surged by 217.8% yoy to Rs301.1cr during 4QFY2010. However, higher Interest and Depreciation resulted in a 84.5% yoy jump in the Net Profit to Rs141.9cr. Exhibit 1: 4QFY2010 Performance (Consolidated) Y/E March (Rs cr) 4QFY10 4QFY09 % chg FY10 FY09 % chg Net Sales (include Other 2,028 843 140.5 6,924 2,640 162.3 Op. Inc.) Consumption of RM 1,193 524 127.5 4,166 1,549 168.9 (% of Sales) 58.8 62.2 60.2 58.7 Staff Costs 301.9 126.2 139.3 1,131.9 344.0 229.1 (% of Sales) 14.9 15.0 16.3 13.0 Exchange Fluctuation (51.8) (4.9) 951.1 (64.9) 33.1 (296.1) (% of Sales) (2.6) (0.6) (0.9) 1.3 Other Expenses 283.9 102.9 175.9 996.1 418.7 137.9 (% of Sales) 14.0 12.2 14.4 15.9 Total Expenditure 1,727 749 130.7 6,229 2,345 165.6 Operating Profit 301.1 94.8 217.8 695.0 294.7 135.9 OPM 14.8 11.2 10.0 11.2 Interest 21.5 11.2 91.7 62.0 35.4 75.0 Depreciation 77.7 35.4 119.6 260.1 97.9 165.7 Other Income 0.7 2.4 (71.7) 12.9 5.0 159.5 PBT (excl. Extr. Items) 202.7 50.6 300.6 385.8 166.3 132.0 Extr. Income/(Expense) 24.0 (43.5) - 33.7 (44.8) - PBT (incl. Extr. Items) 178.7 94.1 89.9 352.1 211.1 66.8 (% of Sales) 8.8 11.2 5.1 8.0 Provision for Taxation 36.8 17.2 114.0 109.4 34.9 213.7 (% of PBT) 20.6 18.3 31.1 16.5 Reported PAT 141.9 76.9 84.5 242.7 176.3 37.7 PATM 7.0 9.1 3.5 6.7 Equity capital (cr) 37.5 35.6 37.5 35.6 EPS (Rs) 3.8 2.2 75.1 6.5 5.0 30.7 Source: Company, Angel Research May 18, 2010 2
  • 3. Motherson Sumi Systems I 4QFY2010 Result Update Standalone Performance On a Standalone basis as well, the company reported a robust 69.9% yoy growth in its Top-line to Rs552cr (Rs325cr), and a 242.3% yoy increase in the Bottom-line to Rs57.9cr (Rs16.4cr). The Net Profit includes an exchange difference profit of Rs40cr (Rs1.3cr loss in 4QFY2009). The OPM (excluding exchange differences) stood higher at 19.4% (17.9%). Raw material and Staff costs have witnessed a decline on a yoy basis, while the Other expenditure increased by about 147bp yoy. Exhibit 2: 4QFY2010 Performance (Standalone) Y/E March (Rs cr) 4QFY10 4QFY09 % chg FY10 FY09 % chg Net Sales (include Other Op. 551.9 324.8 69.9 1,758.1 1,322.9 32.9 Inc.) Consumption of RM 315.8 189.9 66.3 1,022.2 779.5 31.1 (% of Sales) 57.2 58.5 58.1 58.9 Staff Costs 44.9 32.2 39.6 164.5 136.0 21.0 (% of Sales) 8.1 9.9 9.4 10.3 Exchange Fluctuation (40.0) 1.3 - (55.5) 31.8 - (% of Sales) (7.3) 0.4 (3.2) 2.4 Other Expenses 84.0 44.7 88.0 264.8 205.2 29.1 (% of Sales) 15.2 13.8 15.1 15.5 Total Expenditure 404.7 268.1 51.0 1,396.0 1,152.3 21.1 Operating Profit 147.2 56.8 159.3 362.1 170.5 112.4 OPM 26.7 17.5 20.6 12.9 Interest 5.7 7.2 (20.3) 26.5 29.1 (8.9) Depreciation 18.4 14.9 23.6 64.6 54.5 18.5 Other Income 1.1 2.0 (42.7) 16.0 9.3 71.7 PBT (excl. Extr. Items) 124.2 36.7 238.5 287.0 96.2 198.2 Extr. Income/(Expense) 20.0 11.0 - 20.0 11.0 - PBT (incl. Extr. Items) 104.2 25.7 305.6 267.0 85.2 213.3 (% of Sales) 18.9 7.9 15.2 6.4 Provision for Taxation 46.3 9.3 399.0 88.6 15.7 464.2 (% of PBT) 44.4 36.1 33.2 18.4 Reported PAT 57.9 16.4 252.8 178.5 69.5 156.6 PATM 10.5 5.1 10.2 5.3 Equity capital (cr) 37.5 35.6 37.5 35.6 EPS (Rs) 1.5 0.5 242.3 4.8 2.0 143.3 Source: Company, Angel Research Segment-wise Performance The Auto Segment clocked an 83.2% yoy increase in Sales to Rs539cr (Rs294cr), while Non-Auto Sales jumped 84.6% yoy to Rs49.5cr (Rs26.8cr) in 4QFY2010. The Auto Segment EBIT increased by almost 186.3% yoy to Rs95.2cr (Rs33.2cr), while Non-Auto EBIT spiked a substantial 139.5% yoy to Rs8.3cr (Rs3.5cr) during the quarter. May 18, 2010 3
  • 4. Motherson Sumi Systems I 4QFY2010 Result Update Exhibit 3: 4QFY2010 Segmental Performance Y/E Mar (Rs cr) 4QFY10 4QFY09 % chg FY10 FY09 % chg Total Net Sales 613.7 327.9 87.2 1,845.7 1,343.6 37.4 Auto Segment 538.8 294.1 83.2 1,593.5 1,168.5 36.4 Non-Auto Segment 49.5 26.8 84.6 178.8 147.0 21.6 Other Segments 25.4 6.9 73.5 28.0 Total EBIT 103.5 36.7 181.9 238.8 120.4 98.4 Auto Segment 95.2 33.2 186.3 209.8 108.0 94.3 Non-Auto Segment 8.3 3.5 139.5 29.1 12.4 134.0 EBIT Margin (%) 16.9 11.2 12.9 9.0 Auto Segment 17.7 11.3 13.2 9.2 Non-Auto Segment 16.8 12.9 16.3 8.5 Source: Company, Angel Research SMR turns positive at the PAT level in 2HFY2010 During 4QFY2009, MSSL acquired a global company in the business of rear view mirrors from Visiocorp PLC, with Revenues in excess of Euro 660mn and a normalised EBITDA of approximately Euro 48mn during 2007. Visiocorp PLC was one of the largest players in the rear view mirror business and its customers include General Motors, Ford, Hyundai, Volkswagen, Renault/Nissan, Mercedes Benz, BMW, Audi, Tata JLR and Maruti Suzuki. The acquired entity was incorporated as Samvardhana Motherson Reflectec (SMR) in New Jersey on March 6, 2009, and 95% was owned by Samvardhana Motherson Global Holdings (SMGHL). The deal was executed for a cash consideration of Euro 24.8mn and the issue of consideration shares amounting to Euro 1.5mn to the lenders of the erstwhile Visiocorp Group. SMGHL is a JV between the company and Samvardhana Motherson Finance through their overseas 100% subsidiaries (incorporated in Mauritius). SMGHL has acquired various operating companies engaged in the design, manufacture, assembly of rear view mirrors, operating in Europe, America, Australia and Asia (including India), where MSSL has a successful joint venture (JV), in which it holds 49% stake. SMR registered a positive PAT in 2HFY2010. Additionally, during FY2010, SMR received orders for the supply of mirrors worth approximately Euro 700mn to be supplied over the life of the new models to be launched in 2011. MSSL has been in the process of restructuring the assets acquired through SMR and registered a qoq improvement in Margins. The company achieved its target of around an 8% EBITDA margin in 4QFY2010 on the SMR front. The company stands by its resolve to improve the EBITDA and to generate a decent RoCE. Exhibit 4: SMR Performance (Rs cr) 1QFY10 2QFY10 3QFY10 4QFY10 FY10 Net Sales 882.4 973.9 1,120.6 1,181.9 4,158.7 India 32.2 36.4 42.3 48.4 159.3 Outside India 850.2 937.5 1,078.2 1,133.5 3,999.5 PBIDT 15.1 45.2 72.8 103.1 236.2 OPM(%) 1.7 4.6 6.5 8.7 5.7 Exceptional Inc. / (exp) (17.1) (22.9) (9.0) 92.1 43.0 PAT (44.4) (24.3) 9.2 68.1 8.7 Minority Share (22.1) (13.8) 4.4 34.1 2.8 PAT (22.3) (10.5) 4.7 33.8 5.9 Source: Company, Angel Research May 18, 2010 4
  • 5. Motherson Sumi Systems I 4QFY2010 Result Update Outlook and Valuation MSSL is a leader in Wire Harnessing, controlling over 65% of the domestic passenger vehicle (PV) market and around a 48% market share in the domestic Rear View Mirror market. After the recent acquisition, the company now controls around 25% of the global Rear View Mirror market. The company is now focusing on the supply of higher level assemblies and modules, where Margins are comparatively higher. MSSL is also increasing its content per car, in a bid to diversify its product portfolio. The company is laying emphasis on its global product plan (GPP), where it is looking at setting up JVs with leading Tier-I suppliers to upgrade its technology base and to bolster its clientele as well. We expect MSSL’s consolidated Net Sales to register a substantial growth over FY2010-12E, aided by its strong order-book position. On the Margin front, we have modeled an improvement in the OPM in FY2011E and FY2012E, owing to higher utilisation levels in the domestic and overseas operations, where the company is expected to achieve better Operating leverage. We estimate the company to clock a consolidated EPS of Rs9 for FY2011E and Rs11.1 for FY2012E. At the CMP, the stock is trading at 15.1x FY2011E and 12.3x FY2012E consolidated Earnings (fully diluted). Considering the company’s prospects after the restructuring of SMR and the fact that it is one of the few ancillary companies registering decent numbers, despite having a high presence in overseas markets, we maintain a Buy on the stock, with a Target Price of Rs167, at which the stock would trade at 15x FY2012E EPS. Exhibit 5: One year forward P/E Band 200 180 19x 160 140 15x Share Price (Rs) 120 11x 100 80 7x 60 40 20 0 Apr-02 Apr-03 Apr-04 Apr-05 Apr-06 Apr-07 Apr-08 Apr-09 Apr-10 Oct-02 Oct-03 Oct-04 Oct-05 Oct-06 Oct-07 Oct-08 Oct-09 Source: Company, Angel Research Exhibit 6: One year forward EV/EBIDTA Band 9,000 9x 8,000 7,000 7x 6,000 5,000 EV (Rs cr) 5x 4,000 3,000 3x 2,000 1,000 0 Apr-02 Apr-03 Apr-04 Apr-05 Apr-06 Apr-07 Apr-08 Apr-09 Apr-10 Oct-02 Oct-03 Oct-04 Oct-05 Oct-06 Oct-07 Oct-08 Oct-09 Source: Company, Angel Research May 18, 2010 5
  • 6. Motherson Sumi Systems I 4QFY2010 Result Update Profit & Loss Statement (Rs cr) Y/E March FY2007 FY2008 FY2009 FY2010 FY2011E FY2012E Gross sales 1,706 2,272 2,783 7,526 8,826 9,991 Less: Excise duty 179 244 188 602 706 799 Net Sales 1,528 2,052 2,640 6,924 8,120 9,192 Total operating income 1,528 2,052 2,640 6,924 8,120 9,192 % chg 50.4 34.3 28.7 162.3 17.3 13.2 Total Expenditure 1,307 1,755 2,356 6,229 7,207 8,135 Net Raw Materials 864 1,124 1,549 4,166 5,055 5,791 Other Mfg costs 112 142 141 - 406 460 Personnel 168 247 344 1,132 1,177 1,241 Other 163 242 322 931 568 643 EBITDA 221 297 283 695 914 1,057 % chg 38.5 34.6 (4.6) 145.2 31.4 15.7 (% of Net Sales) 14.4 14.5 10.7 10.0 11.3 11.5 Depreciation& Amortisation 65 85 109 260 288 314 EBIT 156 212 174 435 626 743 % chg 38.0 36.1 (17.9) 149.4 43.9 18.7 (% of Net Sales) 10.2 10.4 6.6 6.3 7.7 8.1 Interest & other Charges 29 29 38 62 53 46 Other Income 35 43 120 13 14 14 (% of PBT) 21.9 20.5 47.0 3.8 2.3 2.0 Recurring PBT 162 226 256 386 587 711 % chg 28.9 39.4 13.1 50.8 52.1 21.2 Extraordinary Expense/(Inc.) 0 19 1 43 - - PBT (reported) 162 207 255 343 587 711 Tax 34 51 35 109 191 231 (% of PBT) 20.7 24.7 13.6 31.9 32.5 32.5 PAT (reported) 128 156 220 233 396 480 Less: Minority interest (MI) (1) (3) 45 (9) 46 49 PAT after MI (reported) 129 159 175 243 350 432 ADJ. PAT 130 178 176 286 350 432 % chg 20.9 37.3 (0.9) 62.0 22.6 23.2 (% of Net Sales) 8.5 8.7 6.7 4.1 4.3 4.7 Basic EPS (Rs) 3.7 4.5 4.9 6.5 9.0 11.1 Fully Diluted EPS (Rs) 3.3 4.1 4.5 6.3 9.0 11.1 % chg 20.1 22.9 10.3 38.5 44.4 23.2 May 18, 2010 6
  • 7. Motherson Sumi Systems I 4QFY2010 Result Update Balance Sheet (Rs cr) Y/E March FY2007 FY2008 FY2009 FY2010E FY2011E FY2012E SOURCES OF FUNDS Equity Share Capital 23 36 36 37 39 39 Preference Capital - - - - - - Reserves& Surplus 356 500 748 1,122 1,330 1,501 Shareholders Funds 380 536 783 1,159 1,369 1,539 Minority Interest 14 23 200 191 237 285 Total Loans 460 489 895 757 657 607 Deferred Tax Liability 7 4 15 15 12 8 Total Liabilities 861 1,052 1,893 2,122 2,275 2,440 APPLICATION OF FUNDS Gross Block 762 949 3,018 3,297 3,641 3,979 Less: Acc. Depreciation 277 346 1,628 1,888 2,175 2,490 Net Block 485 603 1,390 1,409 1,466 1,489 Capital Work-in-Progress 18 28 151 165 182 199 Goodwill - - - - - - Investments 5 5 8 11 11 12 Current Assets 677 904 1,914 3,623 4,025 4,208 Cash 99 95 277 49 68 47 Loans & Advances 136 190 413 1,039 1,218 1,379 Other 441 618 1,224 2,535 2,739 2,783 Current liabilities 382 531 1,597 3,086 3,410 3,469 Net Current Assets 295 373 317 537 615 739 Mis. Exp. not written off 58 42 27 - - - Total Assets 861 1,052 1,893 2,122 2,275 2,440 Cash Flow (Consolidated) (Rs cr) Y/E March FY2007 FY2008 FY2009 FY2010E FY2011E FY2012E Profit before tax 162 207 255 343 587 711 Depreciation 65 85 109 260 288 314 Change in Working Capital 12 (52) (752) (549) (198) (223) Less: Other income 142 48 (450) 247 56 108 Direct taxes paid 34 51 35 109 191 231 Cash Flow from Operations 64 141 27 (303) 430 463 Inc./ (Dec.) in Fixed Assets 184 197 2,191 293 361 355 Inc./ (Dec.) in Investments 0 0 3 2 1 1 Inc./ (Dec.) in loans and advances 28 55 222 626 179 80 Other income 28 10 1,825 - - - Cash Flow from Investing (156) (232) 1,234 (921) (542) (435) Issue of Equity - 12 - 2 1 - Inc./(Dec.) in loans 34 29 406 (138) (100) (50) Dividend Paid (Incl. Tax) 31 42 56 57 77 113 Others (7) (12) 17 - - - Cash Flow from Financing 13 11 333 (193) (175) (163) Inc./(Dec.) in Cash (79) (4) 178 (227) 19 (22) Opening Cash balances 172 99 95 277 49 68 Closing Cash balances 99 95 277 49 68 47 May 18, 2010 7
  • 8. Motherson Sumi Systems I 4QFY2010 Result Update Key Ratios Y/E March FY2007 FY2008 FY2009 FY2010E FY2011E FY2012E Valuation Ratio (x) P/E (on FDEPS) 37.3 30.6 27.8 21.1 15.1 12.3 P/CEPS 24.9 18.7 14.7 10.2 8.3 7.1 P/BV 12.8 9.1 6.2 4.4 3.9 3.5 Dividend yield (%) 1.1 1.0 1.0 1.3 1.8 2.2 EV/Sales 3.1 2.3 1.9 0.7 0.6 0.5 EV/EBITDA 23.8 17.7 18.6 7.6 5.8 5.0 EV / Total Assets 5.7 4.7 2.7 2.5 2.3 2.1 EPS (Basic) 3.7 4.5 4.9 6.5 9.0 11.1 EPS (fully diluted) 3.3 4.1 4.5 6.3 9.0 11.1 Cash EPS 5.5 7.3 9.3 13.4 16.5 19.2 DPS 1.0 1.3 1.3 1.8 2.5 3.0 Book Value 10.7 15.0 22.0 30.9 35.3 39.7 Dupont Analysis EBIT margin 10.2 10.4 6.6 6.3 7.7 8.1 Tax retention ratio 0.8 0.8 0.9 0.7 0.7 0.7 Asset turnover (x) 2.3 2.4 2.1 3.8 3.8 4.0 ROIC (Post-tax) 18.8 18.7 11.7 16.1 19.8 21.8 Cost of Debt (Post Tax) 5.2 4.6 4.8 5.1 5.0 4.9 Leverage (x) 0.9 0.8 0.8 0.7 0.5 0.4 Operating ROE 31.0 30.1 17.0 23.5 27.2 28.4 Returns (%) ROCE (Pre-tax) 19.6 22.2 11.8 21.7 28.5 31.5 Angel ROIC (Pre-tax) 20.5 22.3 10.8 21.0 28.4 31.1 ROE 38.5 38.9 26.7 29.4 27.7 29.7 Turnover ratios (x) Asset Turnover (Gross Block) 2.3 2.4 1.3 2.2 2.3 2.4 Inventory / Sales (days) 41 44 62 42 47 47 Receivables (days) 46 51 65 81 73 61 Payables (days) 51 55 110 103 126 119 WCapital cycle (ex-cash) (days) 35 42 22 14 23 25 Solvency ratios (x) Net debt to equity 0.9 0.7 0.8 0.6 0.4 0.4 Net debt to EBITDA 1.6 1.3 2.2 1.0 0.6 0.5 Interest Coverage (EBIT / Int.) 5.3 7.4 4.5 7.0 11.9 16.3 May 18, 2010 8
  • 9. Motherson Sumi Systems I 4QFY2010 Result Update Research Team Tel: 022-4040 3800 E-mail: research@angeltrade.com Website: www.angeltrade.com DISCLAIMER This document is solely for the personal information of the recipient, and must not be singularly used as the basis of any investment decision. Nothing in this document should be construed as investment or financial advice. Each recipient of this document should make such investigations as they deem necessary to arrive at an independent evaluation of an investment in the securities of the companies referred to in this document (including the merits and risks involved), and should consult their own advisors to determine the merits and risks of such an investment. Angel Securities Limited, its affiliates, directors, its proprietary trading and investment businesses may, from time to time, make investment decisions that are inconsistent with or contradictory to the recommendations expressed herein. The views contained in this document are those of the analyst, and the company may or may not subscribe to all the views expressed within. Reports based on technical and derivative analysis center on studying charts of a stock's price movement, outstanding positions and trading volume, as opposed to focusing on a company's fundamentals and, as such, may not match with a report on a company's fundamentals. The information in this document has been printed on the basis of publicly available information, internal data and other reliable sources believed to be true, and is for general guidance only. Angel Securities Limited has not independently verified all the information contained within this document. Accordingly, we cannot testify, nor make any representation or warranty, express or implied, to the accuracy, contents or data contained within this document. While Angel Securities Limited endeavours to update on a reasonable basis the information discussed in this material, there may be regulatory, compliance, or other reasons that prevent us from doing so. This document is being supplied to you solely for your information, and its contents, information or data may not be reproduced, redistributed or passed on, directly or indirectly. Angel Securities Limited and its affiliates may seek to provide or have engaged in providing corporate finance, investment banking or other advisory services in a merger or specific transaction to the companies referred to in this report, as on the date of this report or in the past. Neither Angel Securities Limited, nor its directors, employees or affiliates shall be liable for any loss or damage that may arise from or in connection with the use of this information. Note: Please refer to the important `Stock Holding Disclosure' report on the Angel website (Research Section). Disclosure of Interest Statement Motherson Sumi 1. Analyst ownership of the stock No 2. Angel and its Group companies ownership of the stock No 3. Angel and its Group companies’ Directors ownership of the stock No 4. Broking relationship with company covered No Note: We have not considered any Exposure below Rs 1 lakh for Angel and its Group companies. . Address: Acme Plaza, ‘A’ Wing, 3rd Floor, M.V. Road, Opp. Sangam Cinema, Andheri (E), Mumbai - 400 059. Tel: (022) 3952 4568 / 4040 3800 Angel Broking Ltd: BSE Sebi Regn No : INB 010996539 / CDSL Regn No: IN - DP - CDSL - 234 - 2004 / PMS Regn Code: PM/INP000001546 Angel Securities Ltd:BSE: INB010994639/INF010994639 NSE: INB230994635/INF230994635 Membership numbers: BSE 028/NSE:09946 Angel Capital & Debt Market Ltd: INB 231279838 / NSE FNO: INF 231279838 / NSE Member code -12798 Angel Commodities Broking (P) Ltd: MCX Member ID: 12685 / FMC Regn No: MCX / TCM / CORP / 0037 NCDEX : Member ID 00220 / FMC Regn No: NCDEX / TCM / CORP / 0302 May 18, 2010 9